![OPI_with_Tag_RGB_300dpi_3in_tall-1.png]](https://knowledge.opisystems.com/hs-fs/hubfs/OPI_with_Tag_RGB_300dpi_3in_tall-1.png?height=50&name=OPI_with_Tag_RGB_300dpi_3in_tall-1.png)
There are several ways to view the historical data on the OPI BLUE platform. First you need to navigate to the Bin Data tab, in there you can either view historical data in the table view, charts or the 3D view.
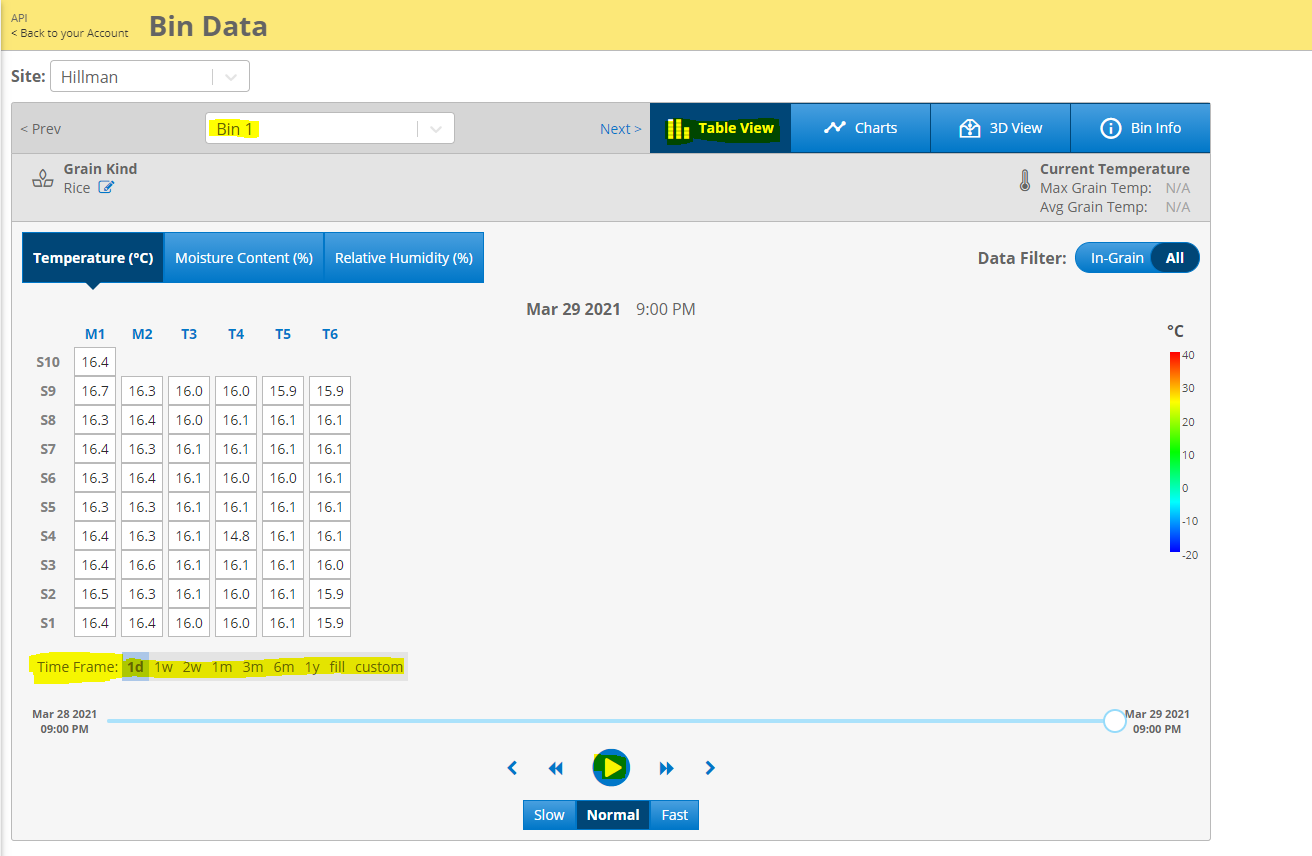
Table View
Within the Bin Data page, select the bin you would like to view and select "Table View". In there you will see the bin data in a tabular format and below the table there is an option to select the time frame you would like to see the data. Select the desired time range and press the play button to see a clip of the historical data. You can also pause and scroll to see a particular date and time you are interested in.
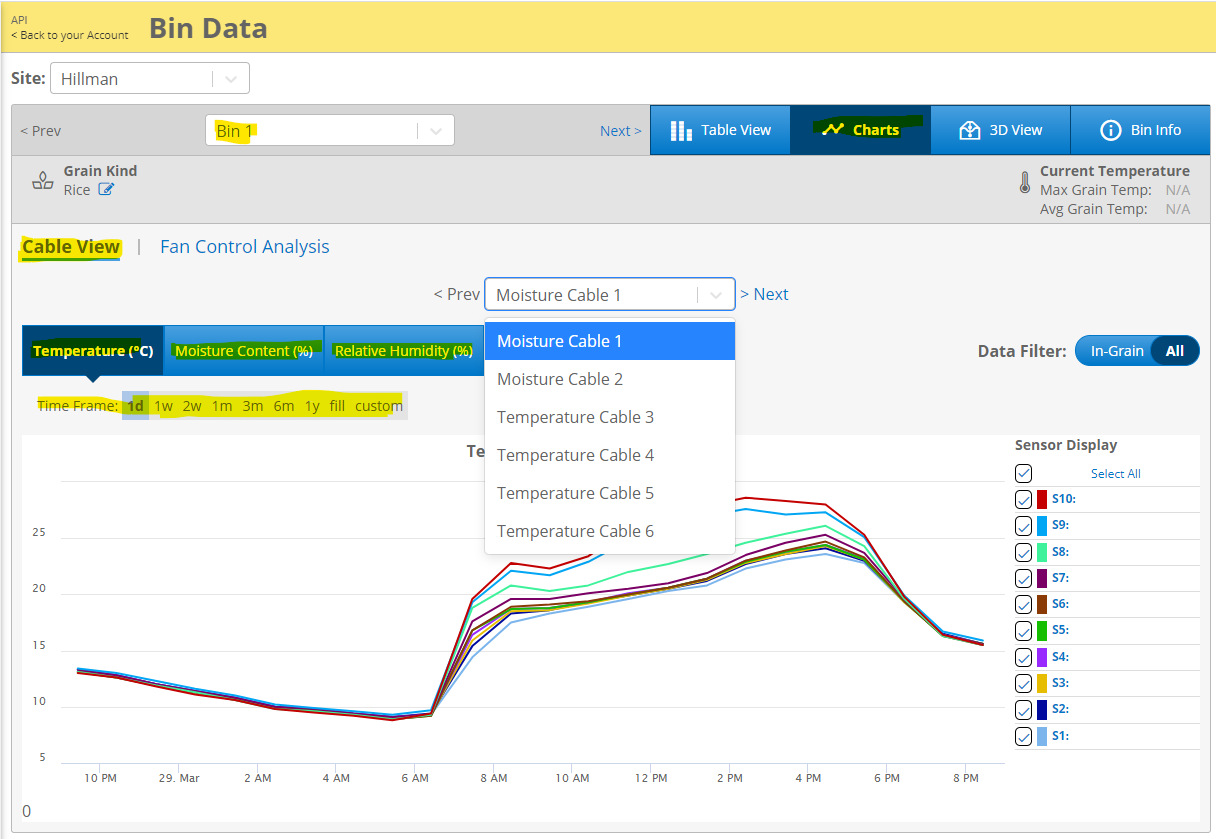
Charts
Within the Bin Data page, select the bin you would like to view and select "Charts", for systems with fan control you have an option to view the fan control analysis data as well. In this view the data is displayed in a graphical format. Please note that you can only view one cable data at a time in this view. You also have the option to select the time range. You can also select to view one or more sensors you are interested in by clicking on the checkmark beside the sensor number.
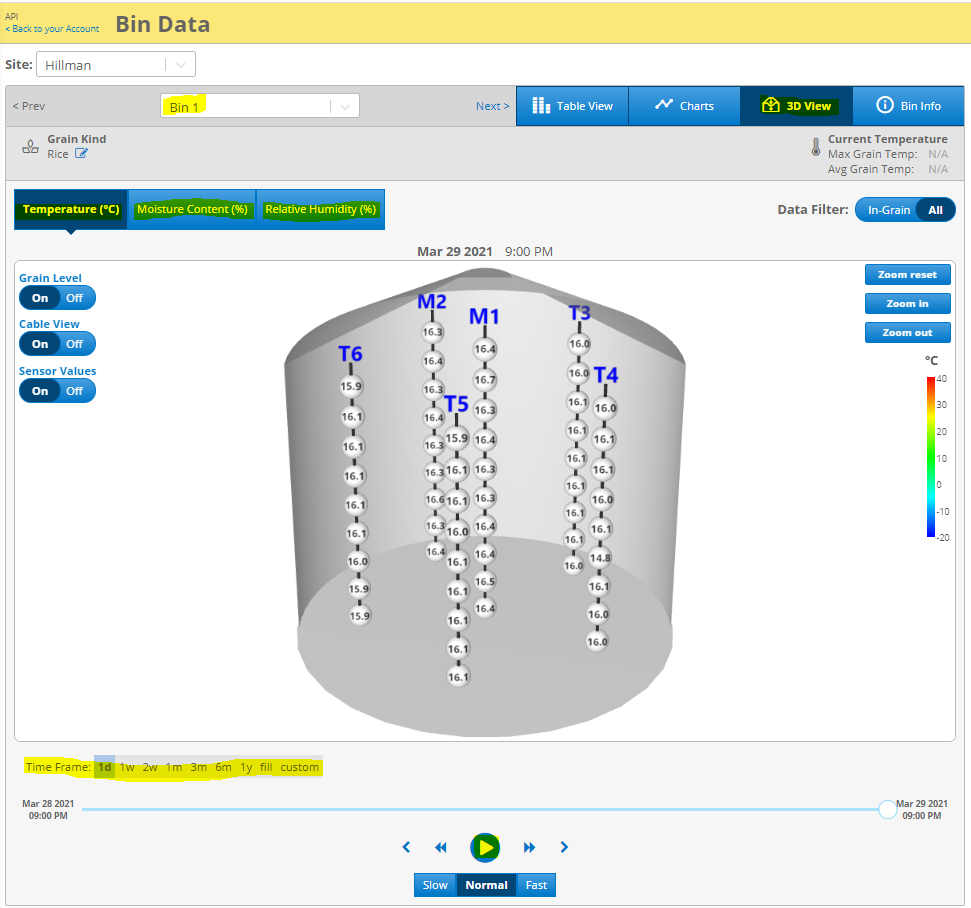
3D View`
Within the Bin Data page, select the bin you would like to view and select "3D View" In this view you will be able to see all the cables as they are arranged in the bin. Similar to the Table View you can select the time range and press play to see a clip of the historical data.
* Please note that at the moment it is not possible to export data or graphs from the website. If you require raw/unfiltered historical data, please send in a request by submitting a support ticket. Generally, we can fulfill these requests within a few weeks.